Introducing enhanced dashboards: Advanced observability with Service Insight System

Having a comprehensive insight into your network performance is paramount, so we are thrilled to announce significant upgrades to our Insights Observability tool available in the DE-CIX self-service portal. These enhancements promise not just better usability but also give you a deeper understanding and more control over your network data.
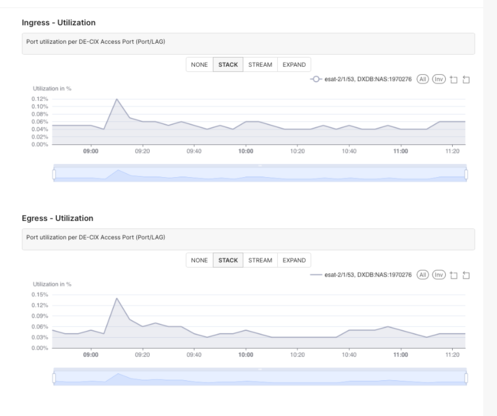
Enhanced usability: We have revamped our dashboards to offer a seamless user experience. With improved usability at the forefront, you can now navigate through the system with ease, gaining a better overview and structure. We have, for example, added filters for data centers and show ingress and egress traffic on one dashboard.
Persistent filters: Switching between dashboards should not mean losing your filtering preferences. Our system now retains the chosen filter values across different dashboards, ensuring a seamless transition and a consistent user experience.
Tailored insights: We have introduced separate dashboards for customer data, reseller data, and DE-CIX as a Service partner data. This tailored approach ensures that each user group receives insights tailored to their specific requirements.
New metric: Service errors (dropped bit/s): We are expanding our metrics repertoire with the addition of Service Errors, focusing on dropped bit/s. This metric provides invaluable insights into network performance, enabling proactive troubleshooting and optimization.
The enhanced Service Insight System represents a significant leap forward in network observability. With optimized usability, intuitive features, and expanded metrics, you can delve deeper into your network to drive informed decision-making and operational excellence.
The Insights Observability tool is available in the DE-CIX Portal as well as in our partner portals.